Re-entry vehicles face an immensely harsh environment at hypersonic speeds not only from aerodynamic heating, but also from severe, unsteady, turbulence-induced pressure fluctuations on the vehicle body, termed the “random vibration” environment. The amplitude of these pressure fluctuations may cause a reaction in the vehicle body (it may start to shake, rattle and roll) that can impact the vehicle’s internal components, thereby raising survivability concerns for all structural components of the vehicle.
Predicting and characterizing the turbulence physics that produce these pressure fluctuations is very complicated due to the chaotic, nonlinear behavior of the equations governing fluid motion at hypersonic conditions. The turbulent events responsible for these pressure fluctuations have a wide range of space and time scales, and thus the body of the vehicle is subjected to a complex, turbulence-induced forcing function.

Historically, researchers utilized a combination of experiments and simulations in simplified configurations (i.e., a vehicle at 0-degree angle-of-attack) to characterize the random-vibration environment due to their respective strengths/weaknesses. Experiments benefit from the ability to rapidly test numerous models/flight conditions but are hindered by the spatio-temporal resolution of the sensors, a difficulty that is exacerbated at hypersonic conditions due to the small turbulence length and time scales. Conversely, high-fidelity simulations can resolve all relevant spatio-temporal turbulence scales, but these simulations require vast amounts of computing resources; thus, only a small subset of conditions can be studied.
Due to the limited number of experiments and high-fidelity simulations that can be performed, researchers must devise a simplified model to describe the random vibration environment across a breadth of flight conditions using the data from the limited subset of available test cases. Often, this reduced-order model (ROM) is generated by leveraging unique expertise and advanced physical insight. This ROM is a tool for vehicle designers to quickly assess the random vibration environment of a re-entry vehicle, which is inherently coupled to the vehicle›s survivability. However, the tool’s validity only falls within the bounds (and potentially the very near-vicinity) of the subset of flight conditions that it was constructed upon.
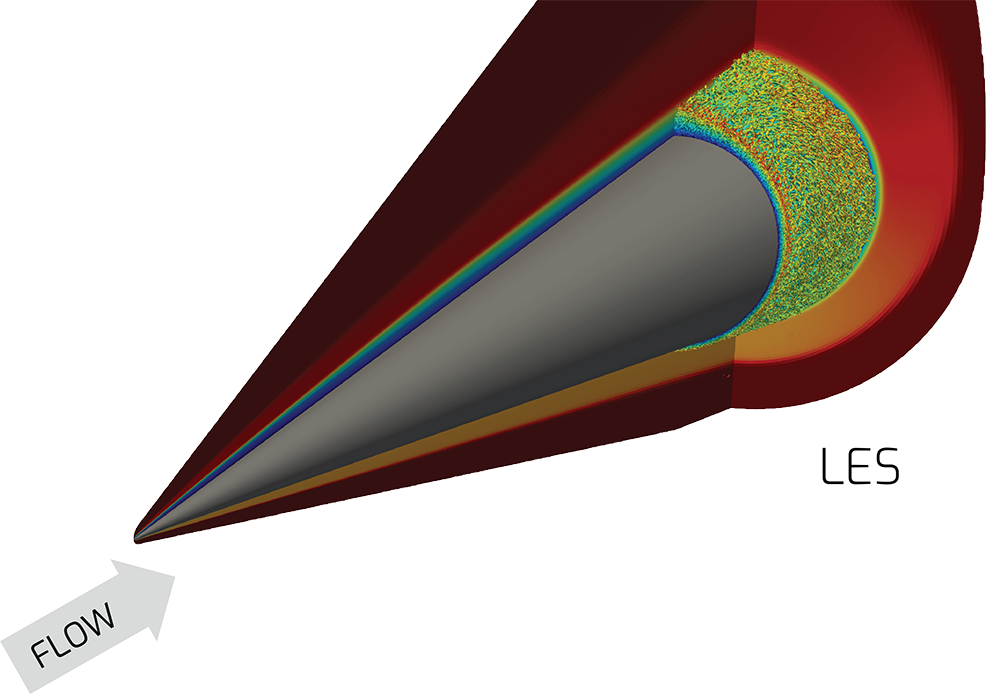
Within the context of this body of work, researchers expanded the validity of the random vibration ROM into more complex, realistic environments by generating new datasets to train the ROM. Namely, high-fidelity Large-Eddy Simulations (LES) of the turbulent flow over representative re-entry vehicles (see Figure 1) were performed over a range of angles-of-attack and flight speeds using the Sandia HPC Parallel Aerodynamics and Re-Entry Code (SPARC). To expedite the time-to-solution for the simulations, researchers leveraged the computational power of the NNSA’s 94.6 petaflop Lawrence Livermore National Laboratory’s Sierra ATS-2 platform.

![Figure 3: Visualization of the temperature field for the flow over a cone at a 6-degree angle[1]of-attack. The surface of the cone is represented by blue lines.](https://www.sandia.gov/app/uploads/sites/165/2022/10/SIERRA-03-1.png)
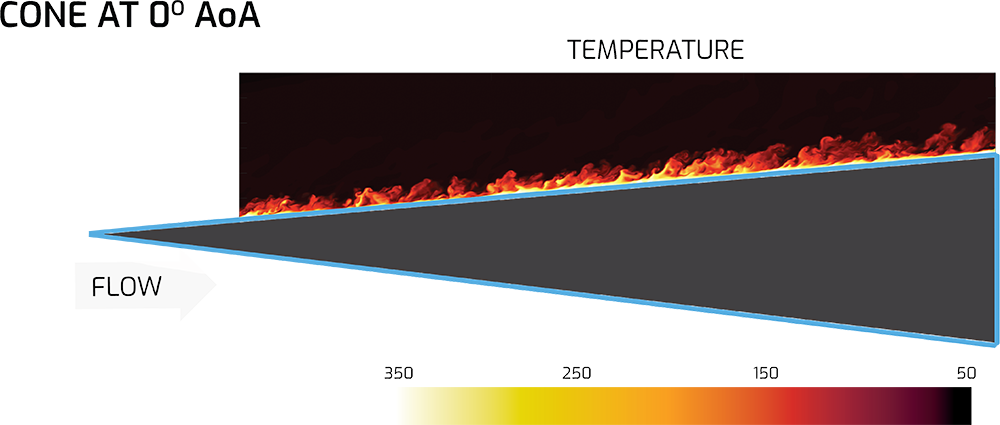
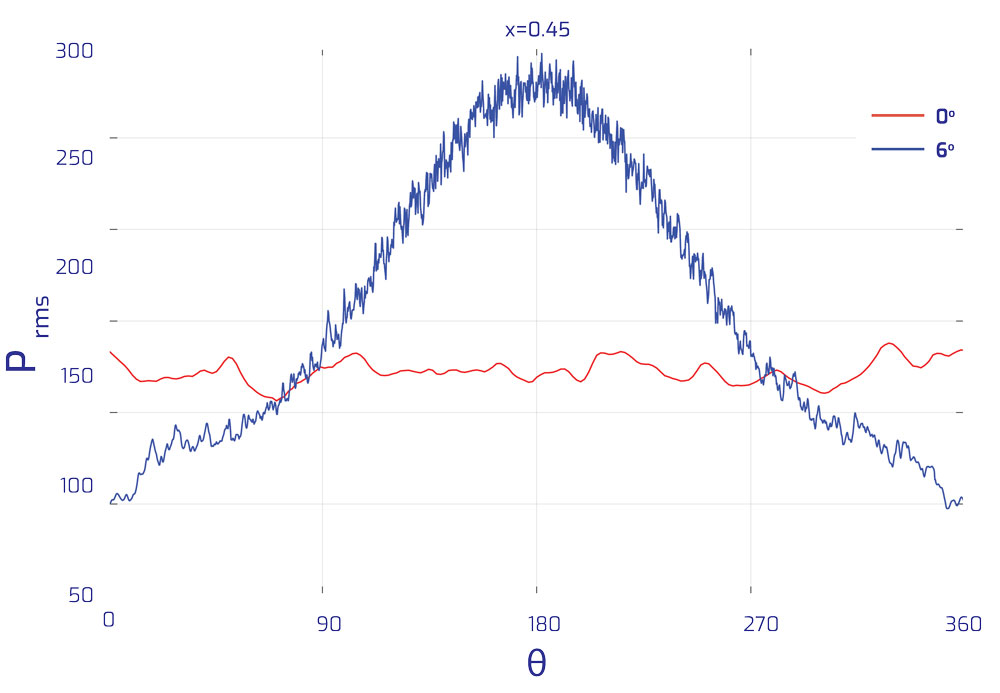
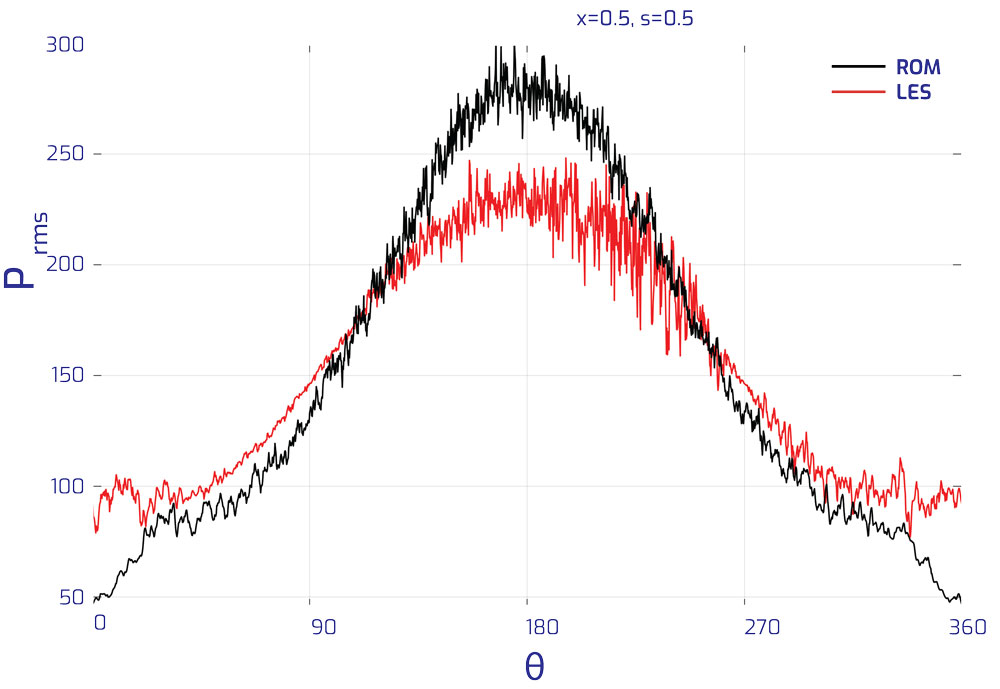
Sample results from the flow over a conical flight body at a 0-degree angle-of-attack are shown in Figure 2, while results from the flow over a cone at a 6-degree angle-of-attack are shown in Figure 3. Visual observation makes it clear that the near-wall turbulence is drastically different for the 6-degree case compared to the 0-degree case. On the wind-side (180-degrees) the turbulence is confined to a much smaller region near the wall, while on the lee-side (0-degrees) the turbulence occupies a larger spatial region. These differences in the turbulence dynamics in turn affect the surface pressure fluctuations (Figure 4), where the 0-degree case and 6-degree cases clearly have different amplitudes of wall-pressure fluctuations. Comparing the results from the 6-degree case to the previous ROM highlights, noticeable deficiencies are evident (Figure 5). Specifically, the previous ROM under-predicts the amplitude of the pressure fluctuations on the wind-side (180-degrees), while also over-predicting the pressure fluctuation amplitude on the lee-side (0-degrees). As a result of the LES simulation campaign, these inherently three-dimensional features of the flow around the re-entry vehicle are now incorporated into the new ROM, thereby increasing its validity across a broader range of flight conditions.


Generating new high-fidelity datasets via large scale computational fluid dynamics simulations made it possible to identify the deficiencies of previous ROMs for random vibration environments, and it allowed the expansion of the ROM to a broader range of flight conditions, thereby mitigating the use of current ROMs outside of their physically applicable scope. Future work will continue to expand the physical scope of the ROM by generating additional training datasets. This improved ROM gives designers an invaluable tool to assess the random vibration environment in more complex scenarios than ever before, permitting more efficient and reliable designs in the development of advanced re-entry systems.