When COVID-19 began its spread across the United States in early 2020, it was important to understand the hitherto unknown rate of infection; to understand the rate of infection, one also needed to know the incubation period distribution of the disease. This was not an easy task because very little was known about the virus and how it spread. For Sandia scientists, the problem of forecasting the spread of an unknown virus sounded all too familiar.
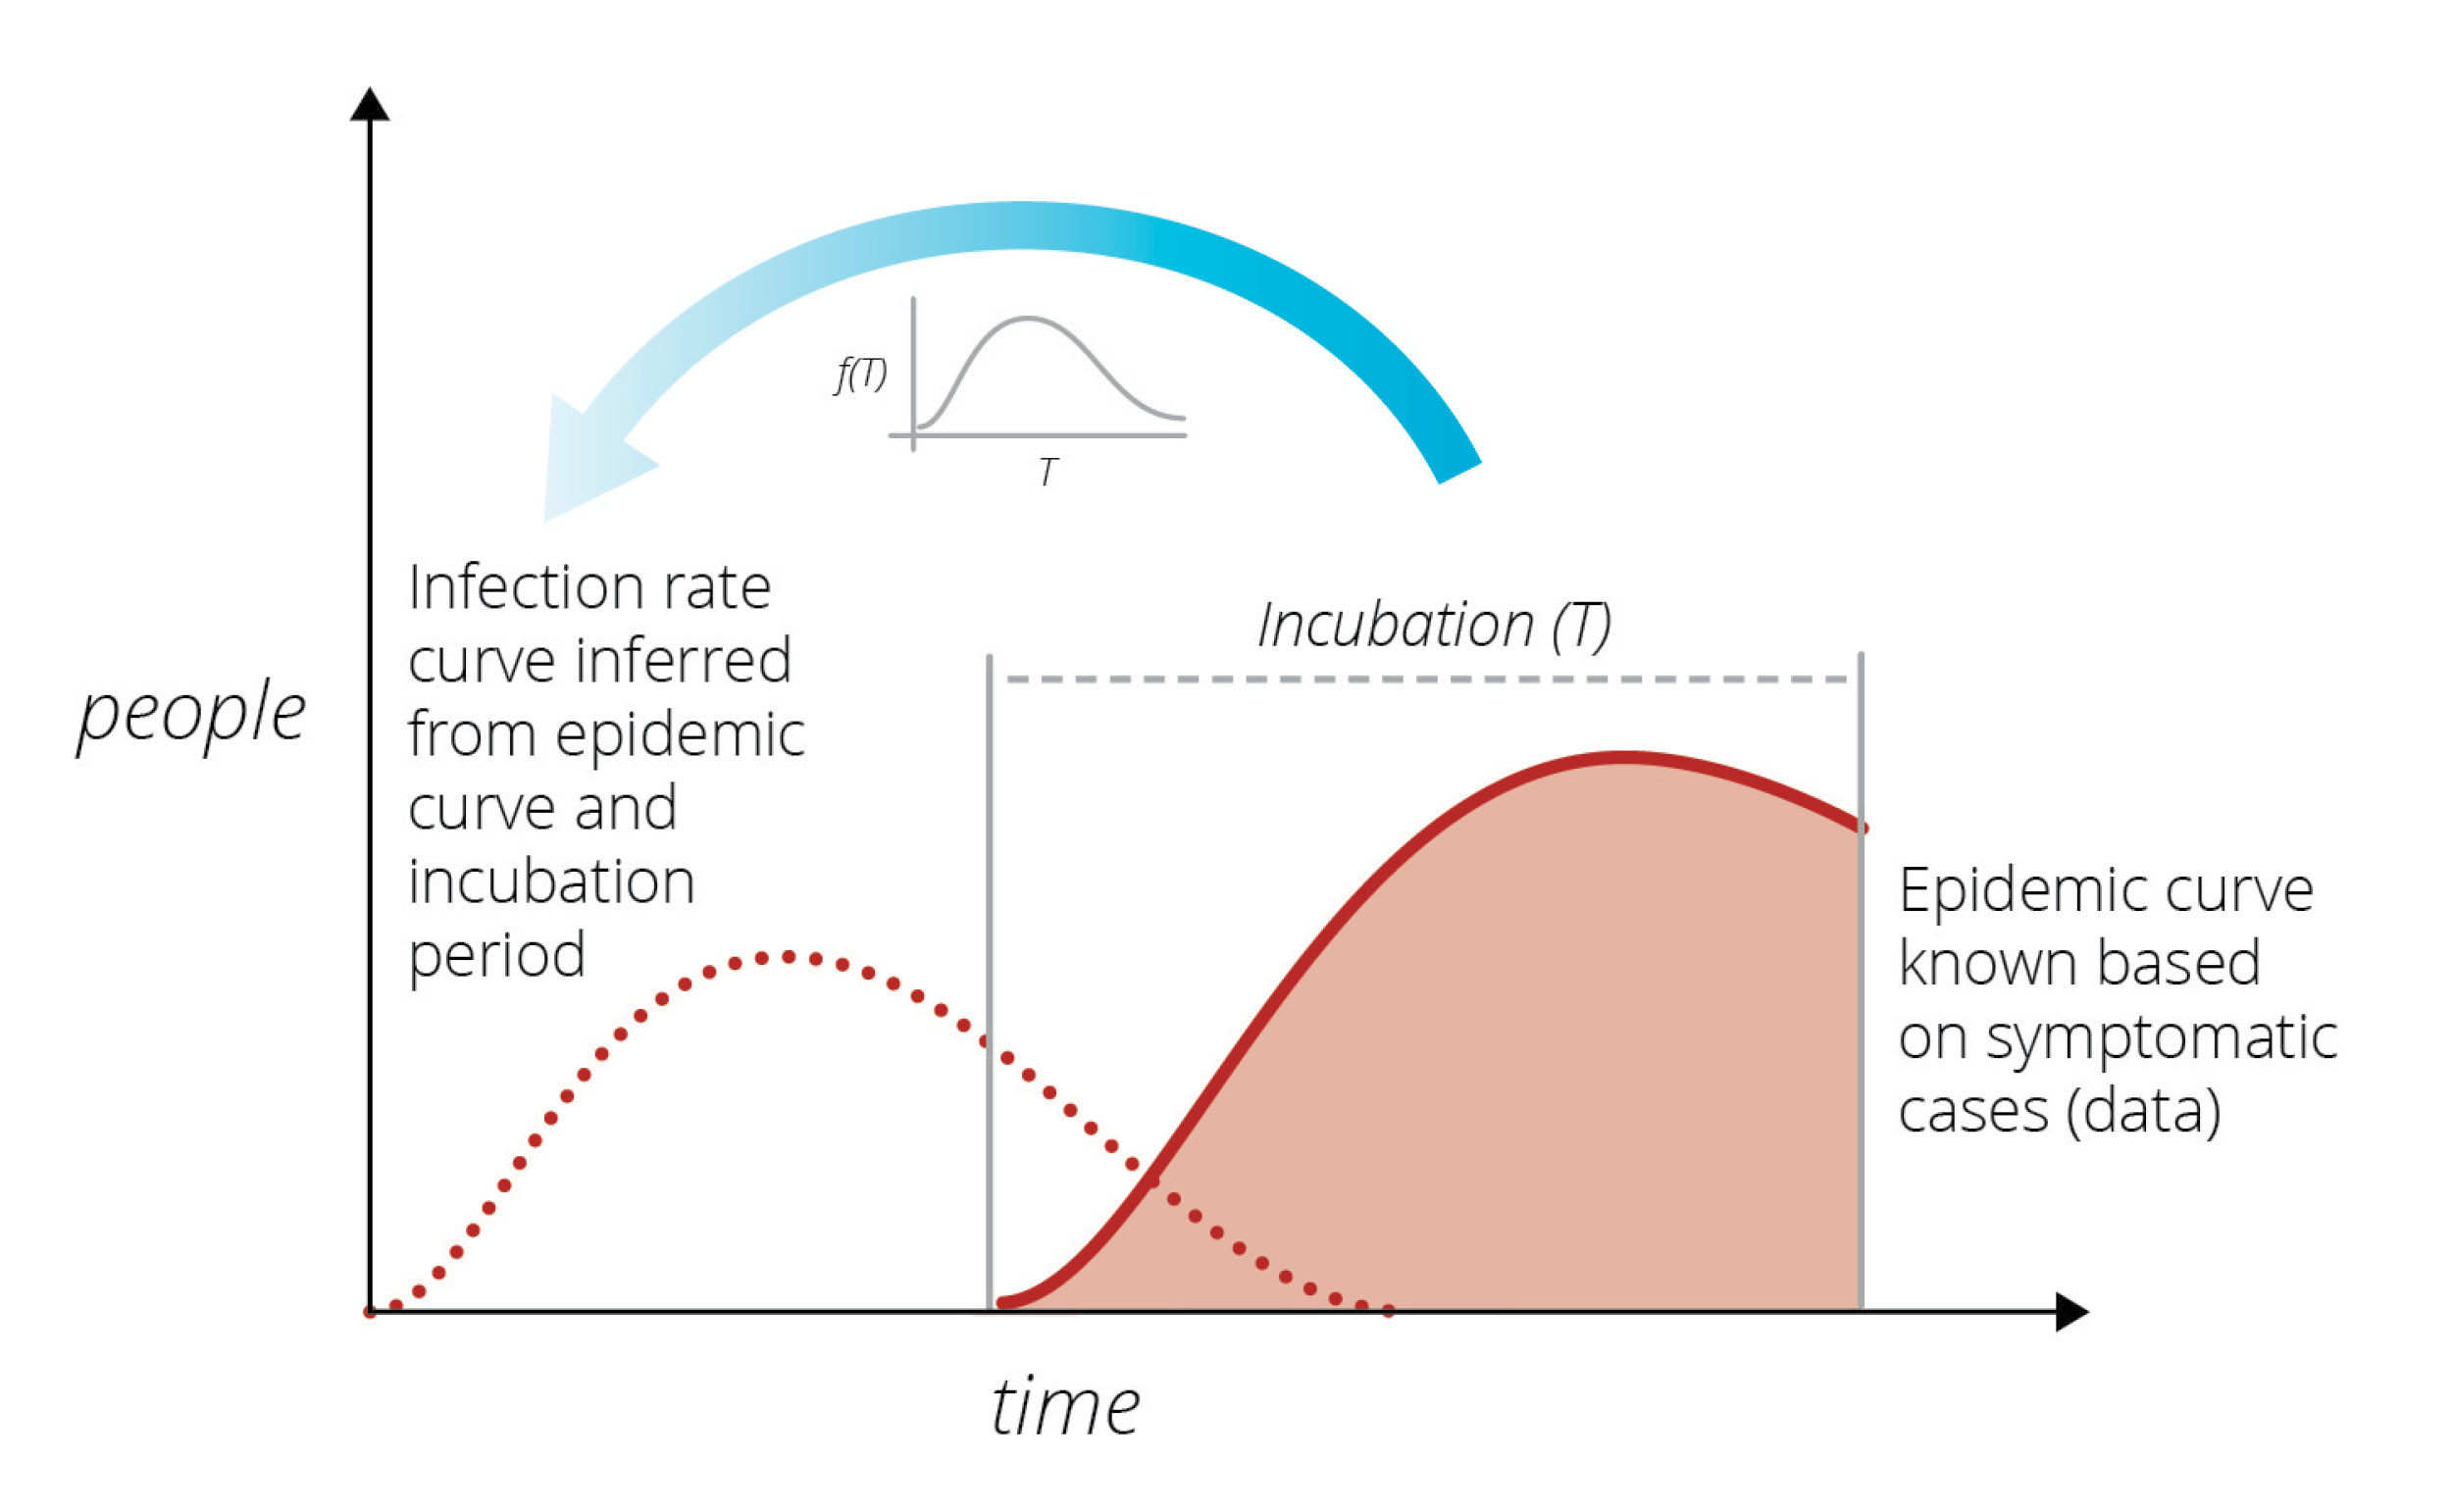
In the early 1980s another unknown virus was killing individuals in San Francisco at an alarming rate. A prominent statistician, Prof. R Brookmeyer, of Johns Hopkins University (currently University of California, Los Angeles), wanted to understand the infection rate of this new virus. (DOI: 10.1080/01621459.1988.10478599). Brookmeyer thought that by knowing how many people were currently exhibiting symptoms, he could work backwards and establish the rate at which they had been infected in the past. This was a difficult task because the incubation period – the time between infection and exhibition of symptoms – varies from person to person and can only be characterized via statistical summaries (i.e., it is a random variable characterized by a distribution). He created a modeling method to provide short-term forecasts of the outbreak.
Sandia researchers were familiar with the modeling used by Brookmeyer from other disease modeling work at Sandia’s Livermore campus. They thought a similar approach could be used to study the rate of spread of the new coronavirus. Its incubation period is much shorter than HIV’s incubation period, and its infection rate far larger, which considerably simplified the modeling task. The goal was to produce short-term forecasts of the epidemic in a purely data-driven manner, free of any modeling assumptions, and thereby help the community understand how the virus would spread. By using a similar method to infer the latent infection rate curve from known data, Sandia researchers could predict the number of cases presenting symptoms over time. Infected cases observed on a given day are a consequence of people infected at various times in the past, coming out of incubation and presenting symptoms.

During the early days of the COVID-19 outbreak, The New York Times and Johns Hopkins University were collecting and publishing data on COVID-19 detections across the country, mostly from hospitals as the patients sought care. Using this raw data, Sandia researchers began a COVID-19 LDRD (Laboratory Directed R&D) project to model the outbreak in California and Italy, and specifically included Bernalillo County in New Mexico where Sandia has its largest number of employees.
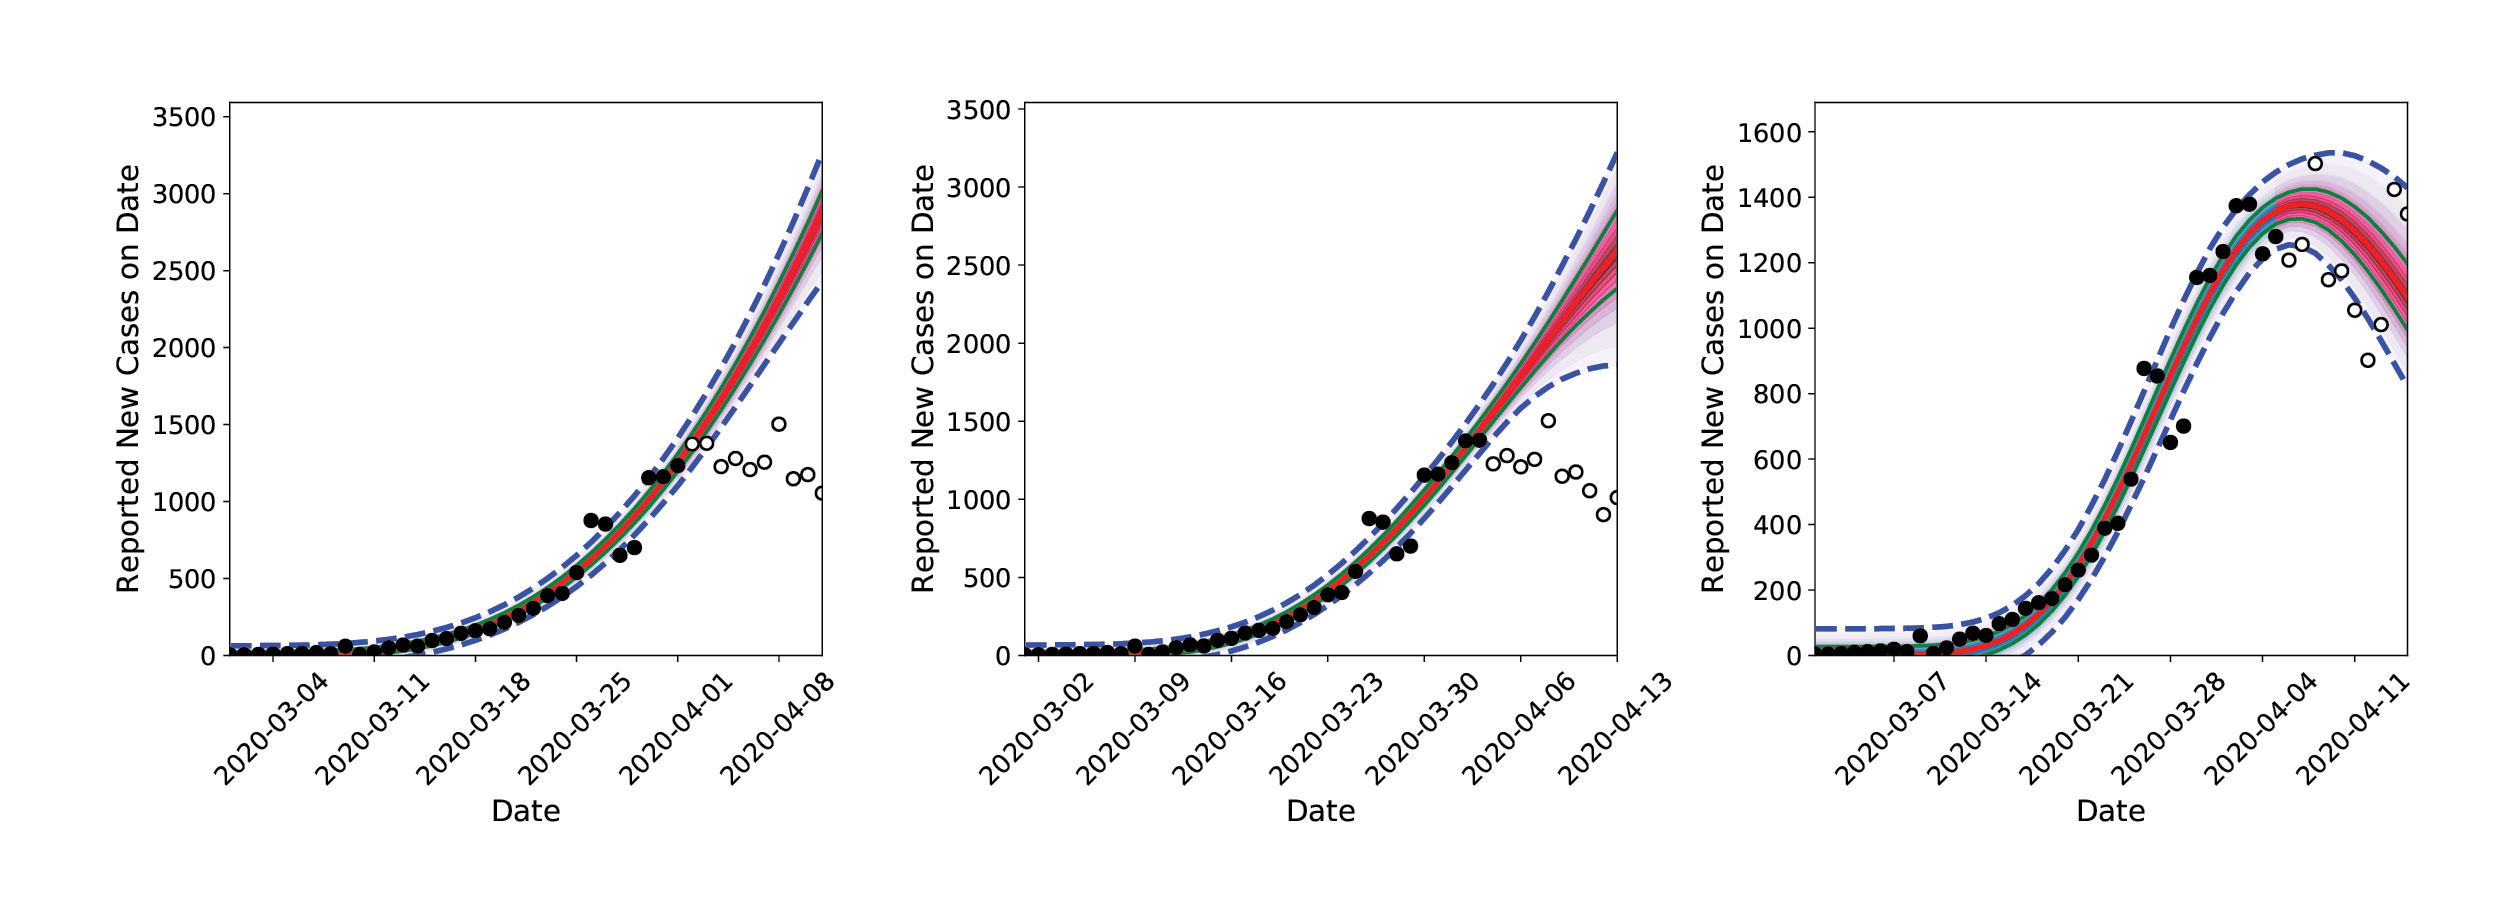
The modeling results surprised the researchers. In late March 2020, much of the United States entered lockdown. By the first week of April, the inferred infection curve showed that infections in California were flattening out, not going up. As more data became available and consistent inferences were drawn, the researchers concluded that the lockdown rules in place were slowing the spread of the virus.

The team’s accurate forecast caught the attention of other Sandia researchers studying the medical resource needs across the country (see Sandia COVID-19 Medical Resource Modeling story, page 50). and the two Sandia researchers in Livermore were asked to provide their daily infection rate predictions for all of the United States. Initially the team used individual personal computers (PC), but they quickly realized that running their model for every state would require harnessing the power of Sandia’s HPC resources.
The researchers recruited a larger group of computational scientists with expertise in statistical inference, software engineering, and parallel computing. The prototypical software and algorithms were restructured for optimal performance on multi-core computers and scaled up for inference-and-forecasting procedures for all 50 states. Calculations that would run 10 hours overnight on a PC could now be performed in 30 minutes with HPC, and additional forecasting was added for a few foreign countries and regions, such as amalgamations of counties in New Mexico. Calculations were performed on the Common Engineering Environment Advanced Compute Servers every night, and forecasts were archived. These calculations revealed differences in flattening the infection rate curve where social distancing restrictions were in place and where they were not (e.g., in Northwest NM [primarily McKinley county]).
Less than three weeks after starting their LDRD research into understanding the spread of the new coronavirus, the team of computational researchers at Sandia were able to predict future infection rates based on data on new cases, via the process of inferring the latent past infection rate. Their results also highlighted that social distancing was a major contributor to slowing the spread of the disease.
Multiphysics Modeling Informs Early Fever Detection Sensor Development
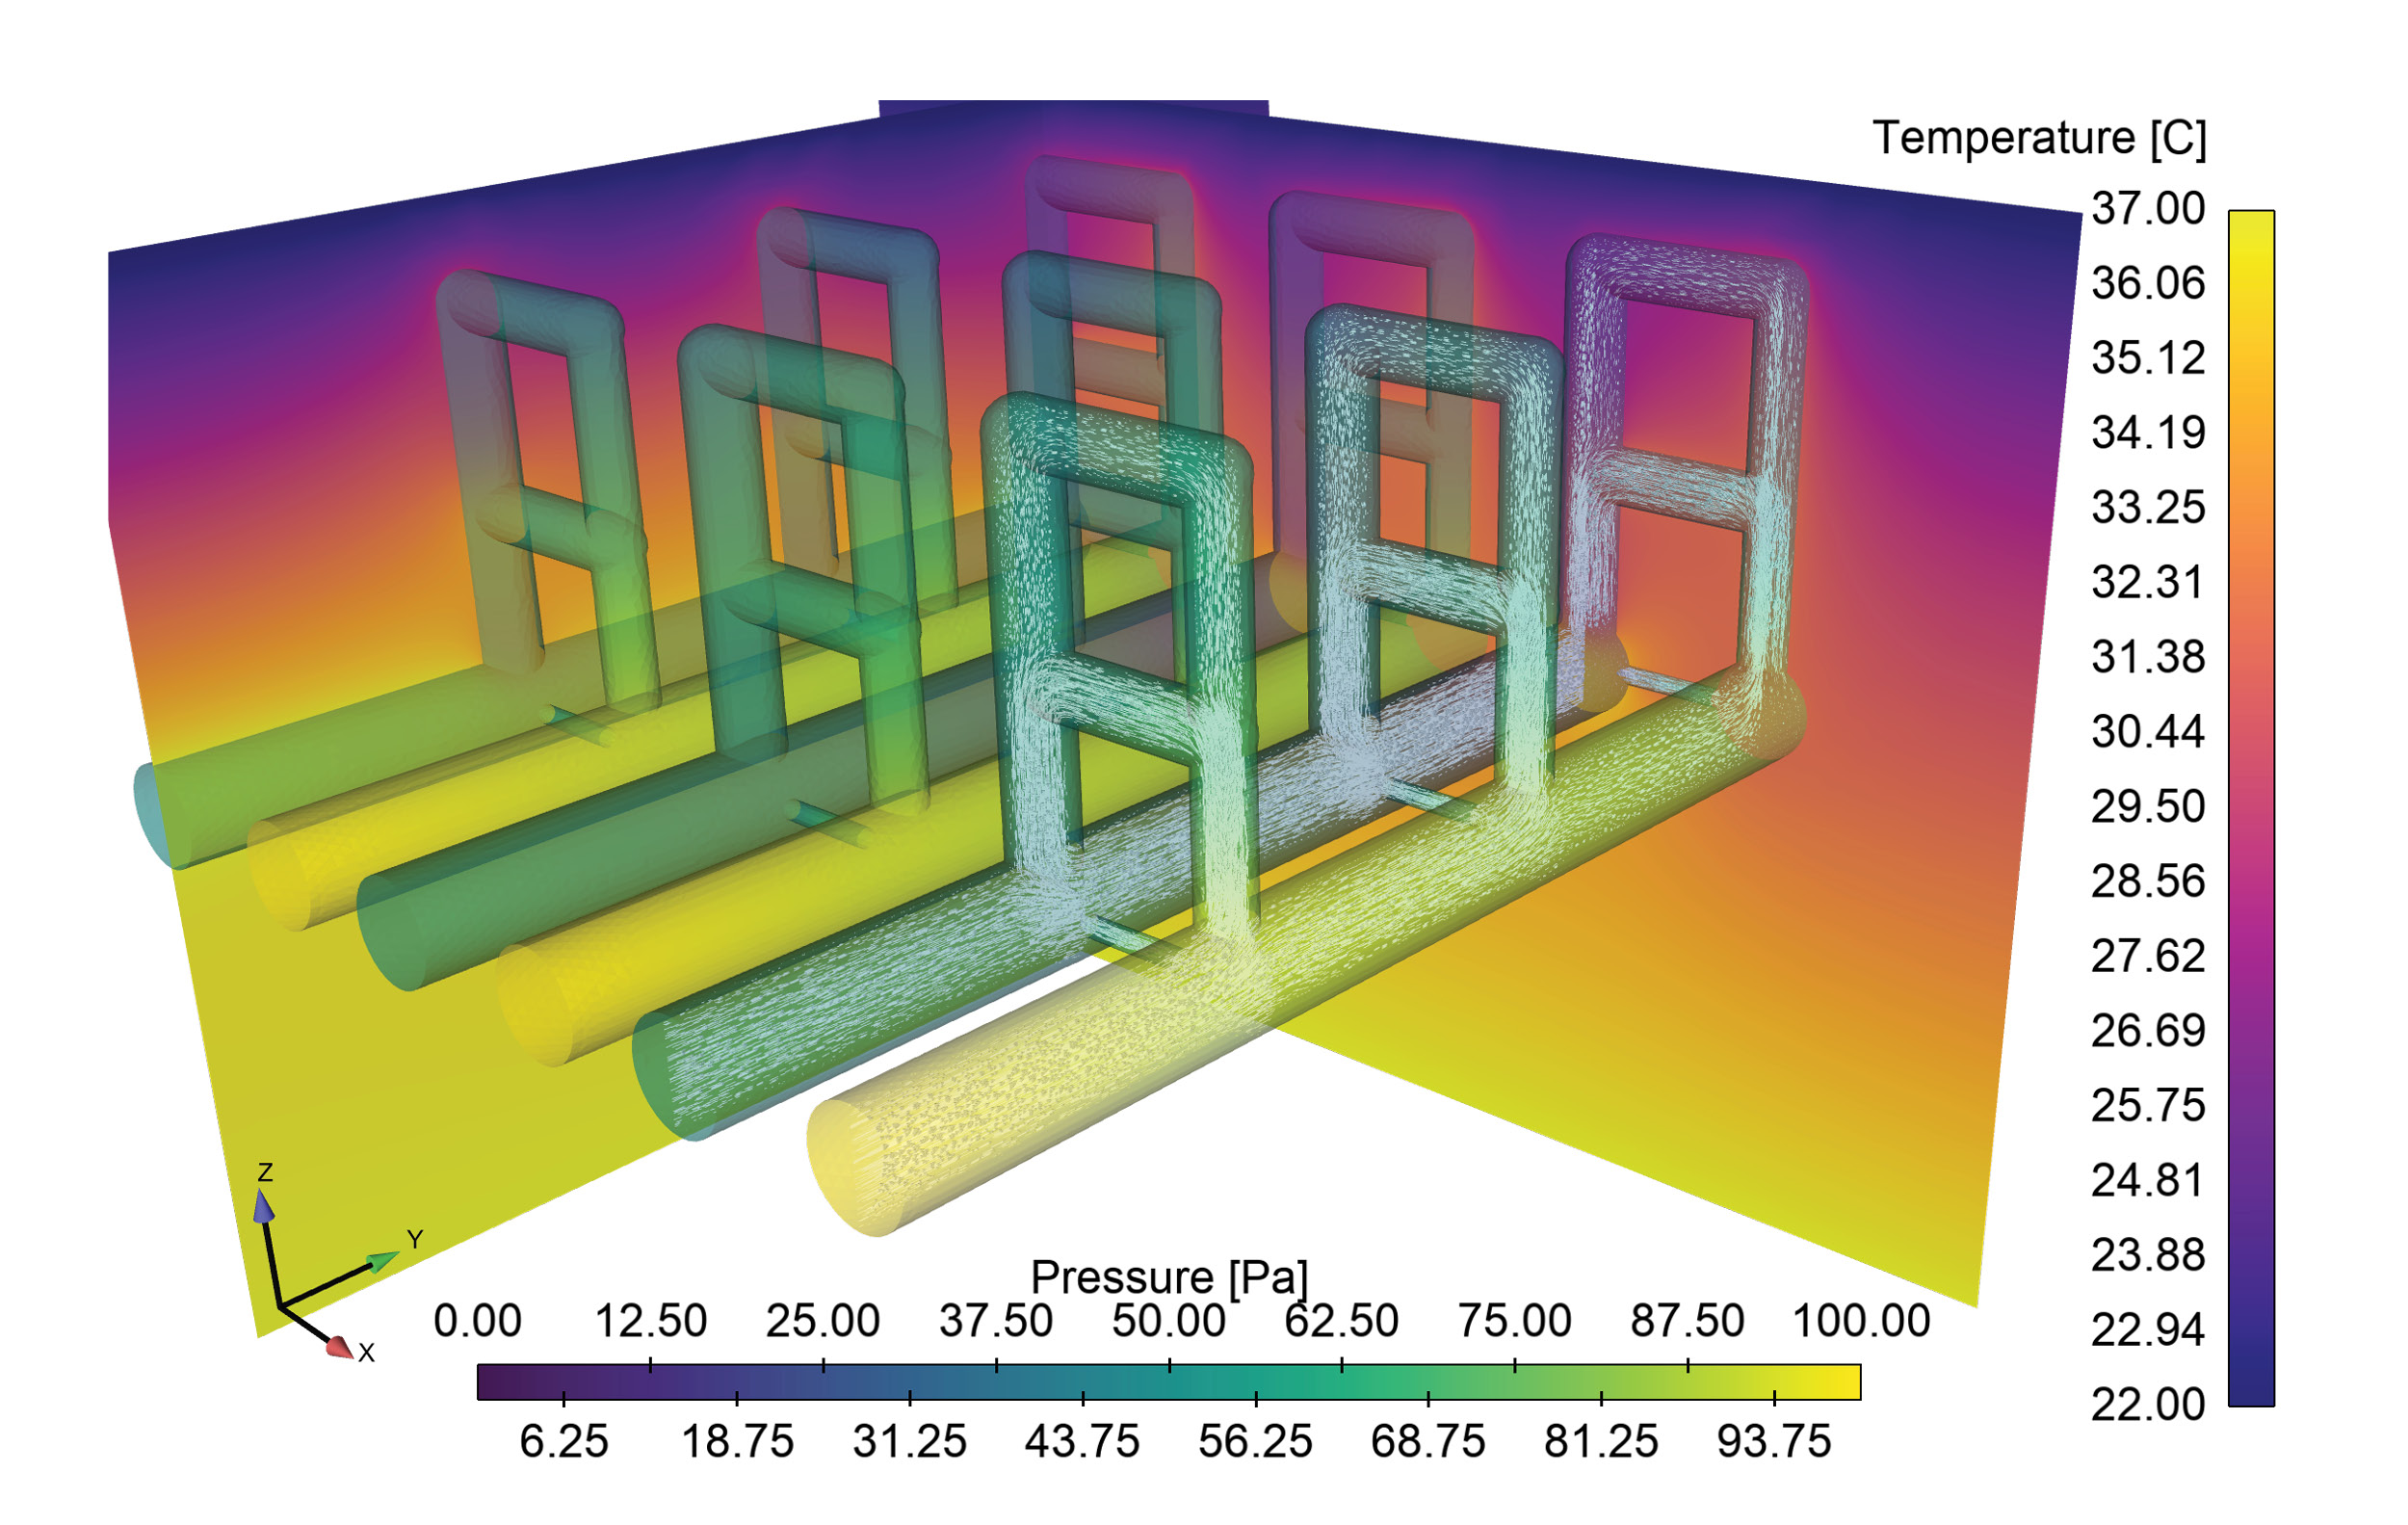
Sandia HPC resources are being used to support a COVID-19 project focused on developing microneedle-based in-situ temperature monitoring technologies. Embedding temperature sensors 1 to 2 millimeters into the skin using Sandia-developed microneedles may allow for early detection of elevated body temperatures prior to it being detectable by external temperature monitors. If successful, this technology will be continually wearable and allow for continuous monitoring and early detection of deviations from the norm, possibly indicating the onset of an infection. Detailed representation of the upper layers of the skin, to include multiple layers of blood vessels and capillary loops, are being computationally modeled using Sandia’s Sierra finite element modeling code suite to model heat transport within the layers, providing a detailed reference to the body conditions that the microneedle-based sensors will be observing. The computational model, pictured in the attached figure, combines blood flow through the complex vessel/capillary networks and the associated heat diffusion and convection. By parameterizing the geometry, the model can quantify the impact of dilation/constriction of blood vessels on heat transport to the skin surface through capillary loops, a key mechanism by which the body controls body temperature.

Additional Resources
- Bayesian Inference and Forecasting of COVID-19 Pandemic Video
- “Characterization of partially observed epidemics through Bayesian inference: application to COVID-19,” published Oct. 7, 2020
- “Daily Forecasting of Regional Epidemics of Coronavirus Disease with Bayesian Uncertainty Quantification, United States,” published March, 2021
- Software for Data-driven Data-driven Epidemiological Inference and Forecasting
Unless otherwise indicated, this information has been authored by an employee or employees of National Technology and Engineering Solutions of Sandia, operator of Sandia National Laboratories with the U.S. Department of Energy. The U.S. Government has rights to use, reproduce, and distribute this information. The public may copy and use this information without charge, provided that this Notice and any statement of authorship are reproduced on all copies.
While every effort has been made to produce valid data, by using this data, User acknowledges that neither the Government nor operating contractors of the above national laboratories makes any warranty, express or implied, of either the accuracy or completeness of this information or assumes any liability or responsibility for the use of this information. Additionally, this information is provided solely for research purposes and is not provided for purposes of offering medical advice. Accordingly, the U.S. Government and operating contractors of the above national laboratories are not to be liable to any user for any loss or damage, whether in contract, tort (including negligence), breach of statutory duty, or otherwise, even if foreseeable, arising under or in connection with use of or reliance on the content displayed in this report.