One of the more challenging difficulties currently faced by the wind industry is understanding the effects of wakes from individual wind turbines and wind plants. The U.S. Department of Energy Wind Energy Technologies Office (WETO) has been investing in exascale codes to help improve understanding of the physics involved in wind turbines and wind plants. To help increase reliability and reduce uncertainty and risk, these models need to be validated and improved.
The American WAKE experimeNt, or AWAKEN, is a project funded by WETO and developed to address these challenges. A field campaign, involving partnerships with several national laboratories, industry and academia, covers five wind plants in north-central Oklahoma and has been collecting data from meteorological stations at 13 field sites, including scanning lidars, dual-Doppler radars, and three wind turbines fitted with over 50 unique instruments. Nacelle mounted lidars were also placed on five turbines. The measurements will be used to validate wind plant models, which in turn will provide a better understanding of phenomena like how wakes influence power production, wake steering strategies and optimal plant layout. The video in Figure 1 shows an overview of the project.
Computational fluid dynamics calculations are playing two important roles in this project. First, simulations were run before the instruments were deployed to help with instrument layout and scan strategies. And now that data has been collected for over a year, instances are being flagged for benchmark challenges, where multiple models will be compared in a blind study. These benchmark cases will evaluate models for a number of physical phenomena, such as plant wakes, wake controls and blockage effects. The effects of wakes from other turbines and placement of a turbine within the plant on power outputs can be seen in Figure 2.
![Figure 2. Turbine power generation depends on location within wind plant. Upstream turbine rows produce more power than downstream turbine rows. Inlay: The King Planes turbine layout [black squares] with colors indicating which row the turbine belongs to.](https://www.sandia.gov/app/uploads/sites/165/2024/10/AWAKEN-Page4Fig2.png)
Sandia has been relying on HPC resources to participate in these tasks and has run large eddy simulations (LES) on large sections of two of the wind plants in the study. The team has been using two codes from the Exa-Wind Suite, Nalu-Wind and AMR-Wind, which both have developers from Sandia. These codes solve the flow of the atmospheric boundary layer using incompressible Navier-Stokes equations with buoyancy and Coriolis forcing terms. Wind turbines are represented by coupled OpenFAST actuator disk models based on the actual turbines in the field. Figure 3 shows an example of the wake from a single turbine. A typical simulation of the wind plant will have a domain size representing 10x10x1 km using around 250 million elements and 30-40 turbines and would be run on over 1,500 processors.
Figure 3. Wake visualization for a single turbine modeled with an actuator line. Streamwise velocity is shown in the blue/green/yellow planes and the spanwise vorticity is shown in red/blue.
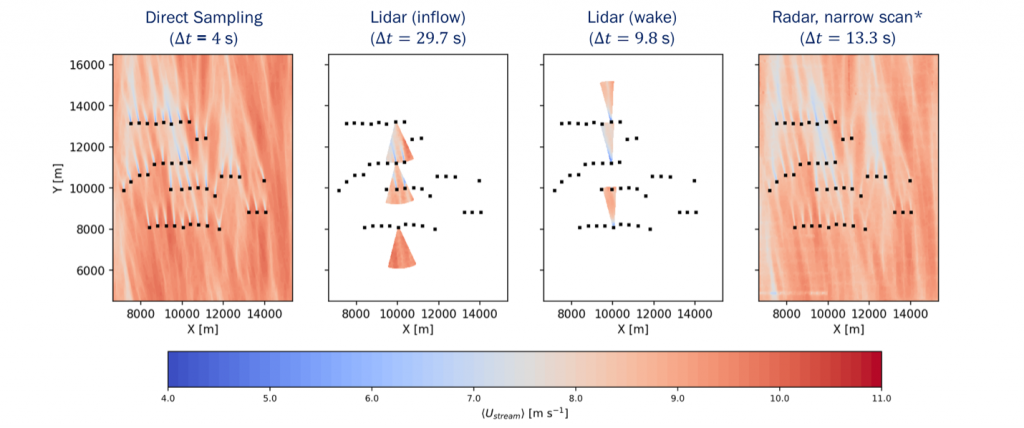
A unique development for the simulations done at Sandia is the implementation of “synthetic instrumentation.” Instead of looking at simulation data along planes or lines, the sampling patterns of the actual instrumentation data collection are used to save velocity data, allowing for a more one-to-one comparison of simulation data to instrument data. For example, the lidars use line-of-sight Doppler data from lasers scattered off particles in the air. The pointing of the laser has a particular pattern that will map out the velocities in a specified area. The synthetic lidar records the velocities in the simulation using the same locations and timing patterns as the lidar in the field. The team is using this method for lidars, dual X-band radars, tethered balloons and meteorological stations. A comparison of a plane of data with the synthetic lidar and radar images is seen in Figure 4.

Because the benchmark cases are simulations of actual atmospheric conditions seen for a period at the site in Oklahoma, significant care must go into matching the details of the flow in the atmospheric boundary layer as well as making sure the turbine models are calibrated correctly. A “precursor” simulation is run without any turbine models to capture the wind velocity, turbulence intensity, shear strength and the temperature profile. Once the flow has been established and run for a long enough period of time to ensure the correct statistics of the flowfield, the simulation is run again with the same inflow conditions, but this time with the wind turbines included as either actuator line or disk models by coupling the boundary layer flow with the OpenFAST turbine models placed in the same locations as those in the actual wind plant.
Figure 5. Hub-height plane view of simulation of King Planes wind plant during stable atmospheric conditions.
Due to the large size of the domain and the fine grids needed for the LES calculations, it is impractical to save the full data set at every time step of the calculation. To ensure that enough data is captured to answer the scientific questions, there is substantial planning for what sub-sets of the data are important enough to be stored. In addition to the synthetic instrumentation mentioned before, more traditional planes are also captured. These include planes that capture the inflow and outflow to the plant, the sides and top to capture momentum transport and planes directly in front and in the wakes of individual turbines. There is also a plane at the turbine hub-height across the entire plant to capture general trends in the wakes (see Figure 5).
With this project, the team can determine how well wind plant models work and what needs to be done to improve them. This will help find ways to plan a more effective wind plant layout, which will help provide more efficient, reliable renewable energy for everyone.