Research at extreme pressure at Sandia and Lawrence Livermore national labs

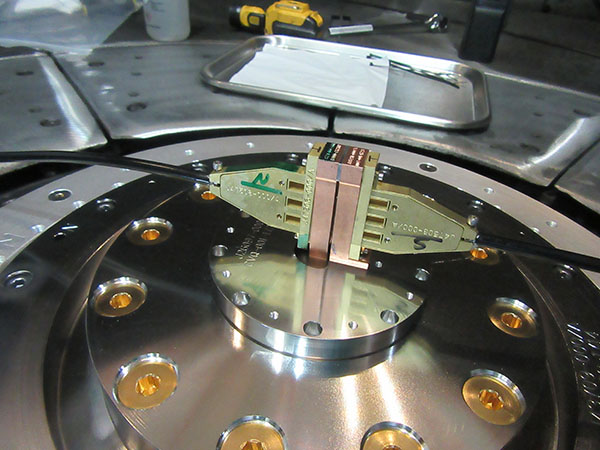
Like two superheroes joining forces, Sandia’s Z machine, generator of the world’s most powerful electrical pulses, and Lawrence Livermore National Laboratory’s National Ignition Facility, the planet’s most energetic laser source, in a series of 10 experiments have detailed the responses of gold and platinum at pressures so extreme that their atomic structures momentarily distorted like images in a funhouse mirror.
Similar high-pressure changes induced in other settings have produced oddities like hydrogen appearing as a metallic fluid, helium in the form of rain and sodium a transparent metal. But until now there has been no way to accurately calibrate these pressures and responses, the first step to controlling them.
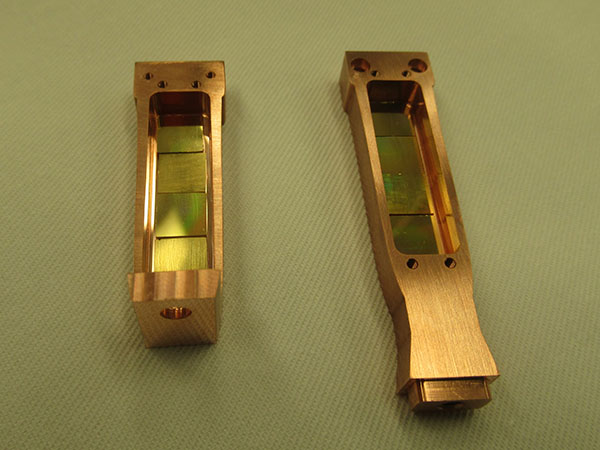
Said Sandia manager Chris Seagle, an author of a technical paper recently published by the journal Science, “Our experiments are designed to measure these distortions in gold and platinum as a function of time. Compression gives us a measurement of pressure versus density.”
Following experiments on the two big machines, researchers developed tables of gold and platinum responses to extreme pressure.
“These will provide a standard to help future researchers calibrate the responses of other metals under similar stress,” said Jean-Paul Davis, another author and Sandia lead scientist in the effort to reliably categorize extreme data.
Data generated by experiments at these pressures — roughly 1.2 terapascals (a terapascal is a trillion pascals), an amount of pressure relevant to nuclear explosions — should aid in understanding the composition of exoplanets, the effects and results of planetary impacts and how the moon formed.
The technical unit called the pascal is so small it is often seen in its multiples of thousands, millions, billions or even trillions. It may be easier to visualize the scale of these effects in terms of atmospheric pressure units. The center of the Earth is approximately 3.6 million times the atmospheric pressure at sea level, or 3.6 million atmospheres. Z’s data reached 4 million atmospheres, or four million times atmospheric pressure at sea level, while NIF reached 12 million atmospheres.
The force of the diamond anvil
Remarkably, such pressures can be generated in the laboratory by a simple compression device called a diamond anvil.
However, “We have no standards by which to measure these extreme ranges,” said Jean-Paul. “While investigators see interesting events, they are hampered in comparing them with each other because what one researcher presents at 1.1 terapascals is only 0.9 on another researcher’s scale.”
What’s needed is an underlying calibration tool, such as the numerical table these experiments helped to create, he said, so that scientists are talking about results achieved at the same documented amounts of pressure.
“The Z-NIF experiments will provide this,” Jean-Paul said.
The overall experiments, under the direction of Lawrence Livermore researcher D. E. Fratanduono, relied on Z machine’s accuracy as a check on NIF’s power.
Z’s accuracy, NIF’s power

Z’s force is created by its powerful shockless magnetic field, generated for hundreds of nanoseconds by its 20 million-ampere pulse. For comparison, a 120-watt bulb uses one ampere.
The accuracy of this method refocused the higher pressures achieved using NIF methods.
NIF’s pressures exceeded those at the core of the planet Saturn, which is 850 gigapascals. But its laser-compression experiments sometimes required a small shock at the start of the compression wave. This raises the material’s temperature, which can distort measurements intended to set a standard.
“The point of shockless compression is to keep the temperature relatively low for the materials being studied,” said Chris. “Basically, the material does heat as it compresses but it should remain relatively cool, hundreds of degrees, even at terapascal pressures. Initial heating is a troublesome start.”
Another reason that Z, which contributed half the number of “shots,” or firings, and about one-third the data, was considered the standard for results up to 400 gigapascals was because Z’s sample size was roughly 10 times as big: 600 to 1,600 microns thick compared to 60 to 90 microns thick on NIF. A micron is a thousandth of a millimeter.
Larger samples, slower pulses equal easier measurements
“Because they were larger, Z’s samples were less sensitive to the microstructure of the material than were NIF’s,” said Jean-Paul. “Larger samples and slower pulses are simply easier to measure to high relative precision.
“Combining the two facilities really tightly constrained the standards,” he said.
Combining Z and NIF data meant that the higher-accuracy, but lower-intensity Z data could be used to pin down the low-to-medium pressure response, and with mathematical adjustments, reduce error on the higher-pressure NIF data.
“The purpose of this study was to produce highly accurate pressure models to approximately one terapascal. We did that, so this combination of facilities has been advantageous,” said Chris.