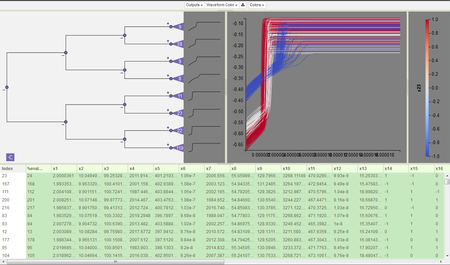
Researchers at Sandia National Laboratories just completed an installation of SNL’s open-source ensemble analysis and visualization system, SlycatTM, at the Army Research Laboratory in Aberdeen, Maryland. This is the culmination of a year-long small project with the ARL that also includes a small amount of support funding for the remainder of FY17 and parts of FY18. Slycat™ will enable ARL users to remotely analyze large ensembles generated by simulation studies performed on Excalibur, a 3,098 node Cray XC40 system. This Slycat™ installation was challenging due to differences between how ARL and Sandia authenticate web-services, connect to High Performance Computing (HPC) platforms (especially in a Single Sign On environment), and launch parallel HPC jobs. As part of this work, the team modularized Slycat™ components to allow administrators to easily reconfigure the deployment configuration, switching between authentication mechanisms required by DOD, DOE, and other communities. These changes allow users outside of Sandia to utilize Slycat’s unique capabilities, increasing the impact of NNSA’s investment in Slycat™ by providing service in the national interest to DOD. (Summary: Researchers at Sandia have deployed the SlycatTM ensemble analysis and visualization system at the Army Research Laboratory.)
