Introduction
A large-scale field demonstration comparing final landfill cover designs was constructed and monitored at Sandia National Laboratories in Albuquerque, New Mexico. Two conventional cover designs (a RCRA Subtitle “D” Soil Cover and a RCRA Subtitle “C” Compacted Clay Cover) were constructed side-by-side with four alternative landfill test covers designed for dry environments. Performance of the covers was based on their ability to minimize the movement of water through each profile. In other words, the cover with the lowest flux was deemed the best performer while the cover that yields the highest flux was the worst performer. Flux is the value used by regulators and consequently design engineers to determine the adequacy of a cover.
Objectives
The overall objective of the research was to provide data and analyses of the performance of six landfill cover designs to aid designers, owners and regulators in selecting appropriate cover designs. Although the field data were site-specific, the results can be judiciously extrapolated to other locations. Specific objectives of this research were:
- Obtain and compare water balance field data. Obtain large-scale water balance field data from six landfill covers subjected to identical field and climatic conditions.
- Design tool accuracy. Numerically predict the water balance performance of the landfill test covers with the two most common computer programs (i.e., UNSAT-H 22 and HELP) used for design of landfill cover systems. These simulations utilized input parameters intended to represent a typical design process. Compare the predicted flux rates from forward simulations with the field data to assess the usefulness of the design tools.
- Simulations using field data. Refine the input parameters used for the water balance simulations of the landfill covers with data collected during the field test (i.e., actual climate, as-built soil property, and vegetation data). Determine the degree to which these simulations predicted observed behavior.
- Modeling study using soil hydraulic properties measured in the field. Measure the final soil conditions (i.e., soil hydraulic properties) of the test covers using a tension infiltrometer seven years after construction was completed. Perform water balance simulations based on these soil data measured at the end of the monitoring period with actual climate and vegetation data. Determine the degree to which these simulations predict the observed data.
Field Demonstration
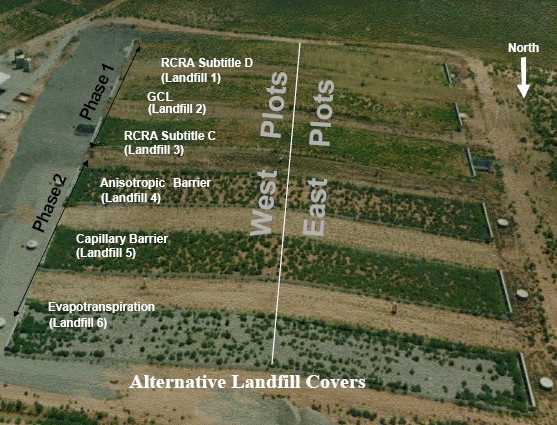
The ALCD landfill covers were divided into two separate bid packages known as Phase I and Phase II. The Phase I covers, constructed in the summer of 1995, include a prescriptive RCRA Subtitle D Soil Cover, a prescriptive RCRA Subtitle C Compacted Clay Cover, and the first of four alternative covers – a Geosynthetic Clay Liner (GCL) Cover. The RCRA Soil and Compacted Clay Covers were constructed to serve as baselines for comparison against the alternative cover designs. The Phase II covers, built in the summer of 1996, include the Capillary Barrier, Anisotropic Barrier, and Evapotranspiration (ET) Cover. The layout of the landfills is shown in the photograph below. Click on the landfill of interest for more information.
 |
| Test Cover Layout |
The test covers were each 13 m wide by 100 m long. All covers were constructed with a 5% slope in all layers. The test covers crowned in the middle with half the cover (50 m) sloping toward the east and the other half of the cover sloping toward the west. The western slope of each cover was passively monitored. The eastern slope of each cover was actively monitored by installing a sprinkler system to facilitate stress testing.
All soil used in the construction of the alternative test landfill covers came from on-site cut excavations. Other materials purchased off-site, such as sand and gravel, were common construction materials and readily available (i.e., no exotic grain-size distributions, etc.). Any and all compaction of soil required by design in the alternative covers was compacted dry of optimum rather than wet of optimum as currently recommended by the EPA for the baseline covers (EPA 1991). Dry-side compaction should result in a compacted barrier soil that is less susceptible to desiccation cracking. Dry-side compaction also made construction easier and therefore less expensive and should provide more soil water storage capability than wet-side storage due to the lower initial degree of saturation.
Performance Monitoring and Instrumentation
 |
| One-site weather station |
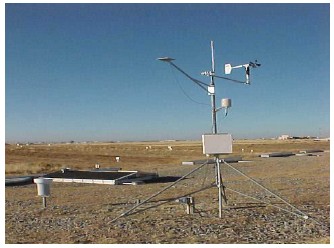
Continuous water balance data for each test cover and meteorological data were obtained at the project site from May 1997 through June 2002. Passive testing consisted of daily on-site observations to validate system performance and to correct problems as they potentially developed. Continuous data was obtained on soil moisture, percolation, lateral drainage, runoff and erosion, precipitation, wind speed and direction, relative humidity, solar radiation, air and soil temperatures. Periodic measurements of 62 vegetation cover, biomass, leaf area index, and species composition were obtained (Dwyer et al., in press, b).
Active testing included the addition of supplemental irrigation to hydrologically stress the cover systems. Water applied using a sprinkler system was tested for rate and uniformity of application. All water was distributed through electronically controlled flow meters where quantities discharged were controlled and measured.
All water balance measurements were made with automated monitoring systems to provide continuous data. Manual backup systems were available in case of failure in one or more of the automated measurements systems and/or to verify accuracy of the automated systems.
For information on each of the measurement systems used, refer to section 3.2 of Water Balance Measurements and Computer Simulations of Landfill Covers (Full reference).
Computer Models
The principal tool available to assist in the design of landfill cover profiles is computer programs used to predict water balance. The two programs utilized in the forward simulations were the Hydrologic Evaluation of Landfill Performance (HELP) program (Schroeder et al. 1994) and the UNSAT-H program (Fayer and Jones 1990). HELP was selected because it is the most popular software used by landfill cover designers and is endorsed by the EPA. It is routinely used for prescriptive cover designs as well as alternative cover designs. All six landfill covers installed and tested were modeled using HELP. UNSAT-H was selected because it appeared to be the most popular water balance program presently used for alternative cover designs. Unlike most unsaturated flow programs, UNSAT-H was specifically developed for the evaluation of landfill covers. UNSAT-H was used to model the Subtitle D Cover, Capillary Barrier, Anisotropic Barrier, and ET Cover. UNSAT-H was not used to model the Subtitle C or GCL Covers because they have geomembranes that could not be readily accommodated by the software. For more information on the use of these programs for this study, refer to section 4.1 of Water Balance Measurements and Computer Simulations of Landfill Covers (Full reference).
The input parameters used for the forward modeling simulations were determined from laboratory and field testing as well as expert opinion obtained prior to the construction of the test covers. The weather data for the simulation period was conservative in that the annual precipitation volume used was above the historical average for the test site. The use of relatively high precipitation is a common design approach. Details for input parameters are found in section 4.2 of Water Balance Measurements and Computer Simulations of Landfill Covers (Full reference).
Results and Discussion
The ET Cover, Anisotropic Barrier and Subtitle C Covers were the best performing designs having the lowest measured flux rates. The ET Cover and Anisotropic Barriers cost less than half that of the Subtitle C Cover to install ( Dwyer 1998). The low flux rate measured through the Subtitle C Cover was shown to primarily be a function of the low effective hydraulic conductivity of the geomembrane. The geomembranes placed in the Subtitle C and GCL Covers have unknown serviceable lives with no field data to reflect the effect on a cover.s flux rate after degradation of the geomembrane. Koerner and Daniel (1997) claim that these geomembranes can continue to function as designed for several hundred years. The lack of available data on a serviceable life for the geomembranes is perhaps a limiting factor in their use in covers on landfills with longlivedwaste such as radioactive waste.
The following table presents the cumulative percolation measured on the test covers. This data suggests that Subtitle D Covers are inadequate, exceeding the suggested maximum 1-mm/year flux requirement (Dwyer et al, in press a). The Subtitle D Cover has an unprotected barrier layer that is subject to desiccation cracking (Montgomery and Parsons, 1990, Suter et al., 1993, Benson et al., 1994), biointrusion (roots, animals, ants, and earthworms) (Waugh et al. 1999), and damage due to freeze/thaw cycles (Benson et al 1995). All of these inherent flaws were shown to exist and contribute to increased saturated hydraulic conductivity for the layer. They also led to preferential flow through the cover that led to the relatively high flux rates measured.
| Landfill Cover | Average Annual Flux (mm/year) |
| Subtitle D | 1.39 |
| GCL Cover | 0.48 |
| Subtitle C | 0.04 |
| Capillary Barrier | 0.16 |
| Anisotropic Barrier | 0.04 |
| ET Cover | 0.05 |
The field data also suggests that GCL covers are suspect due to potential degradation from desiccation and ion exchange (James et al. 1997, Melchoir 1997, Lin and Benson 2000,). The GCL cover was the only cover that showed an increase in flux rate from 1997 through 1999. 1999 was the last year of significant precipitation before a drought began in late 1999 that lead to minimal flux rates through the covers beyond that time.
More detailed results can be found in Water Balance Measurements and Computer Simulations of Landfill Covers. (Full reference).